Historical bond interest rates
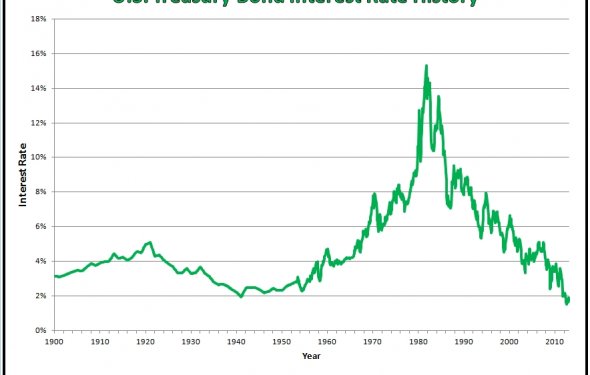
Take a tour of interest rates, financial indicators, and markets over the past century. This model reflects the history of interest rates since 1900. The model dynamically presents the yield curve across each year. The yield curve is the graphical depiction of interest rates across maturities from one to twenty years. Short-term rates are often different from longer-term rates, and the level of interest rates has changed over time. In addition, the model provides a historical perspective on inflation, economic growth, and stock market changes.
If you choose not to enable the macro that provides a dynamic display over time (look for the “Start” button in the upper right corner), you will have manual control over the progression across the century (in the lower left corner). Look for instructions in the lower right corner. Three versions are provided to best suit your screen resolution (a larger size is recommended).